
Care stopped at the clinic door
Infocare’s desktop platform couldn’t address what happened to patients after they left the building.
- Before:
clinic visit, then weeks of nothing: missed medications, forgotten instructions, drift. Then the next clinic visit.
- With SoteriaMe:
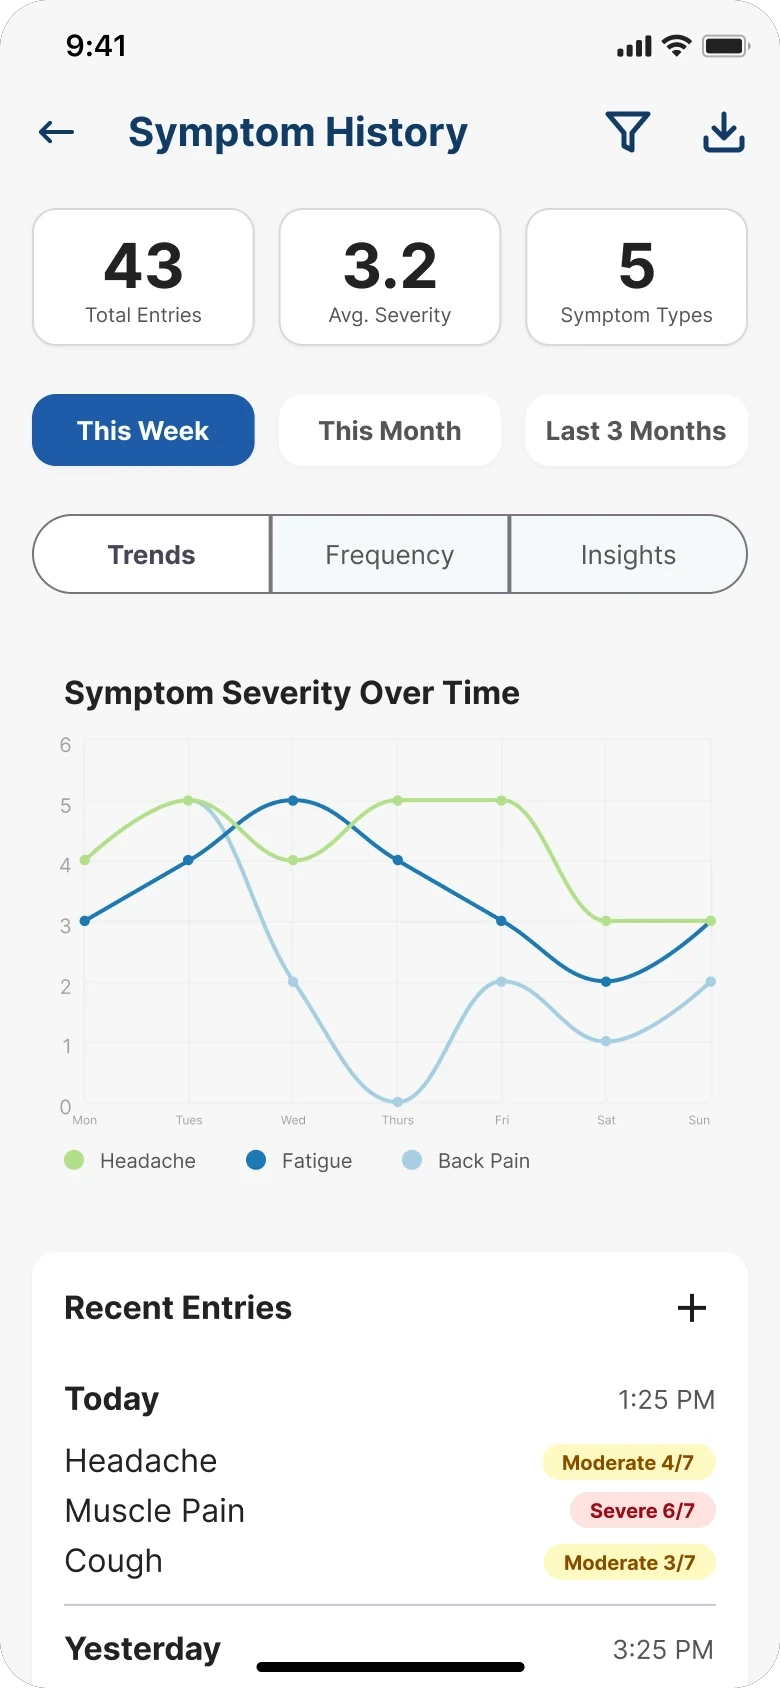
the same two visits, with a medication reminder, a care-plan check-in, a plain-language update, a symptom note and appointment prep in between.
Clinicians absorbed the cost as administrative overhead. Infocare had tried to solve this with email, and it hadn’t worked. SoteriaMe was also the company’s first patient-facing product, which made it a reputational bet as much as a design brief.
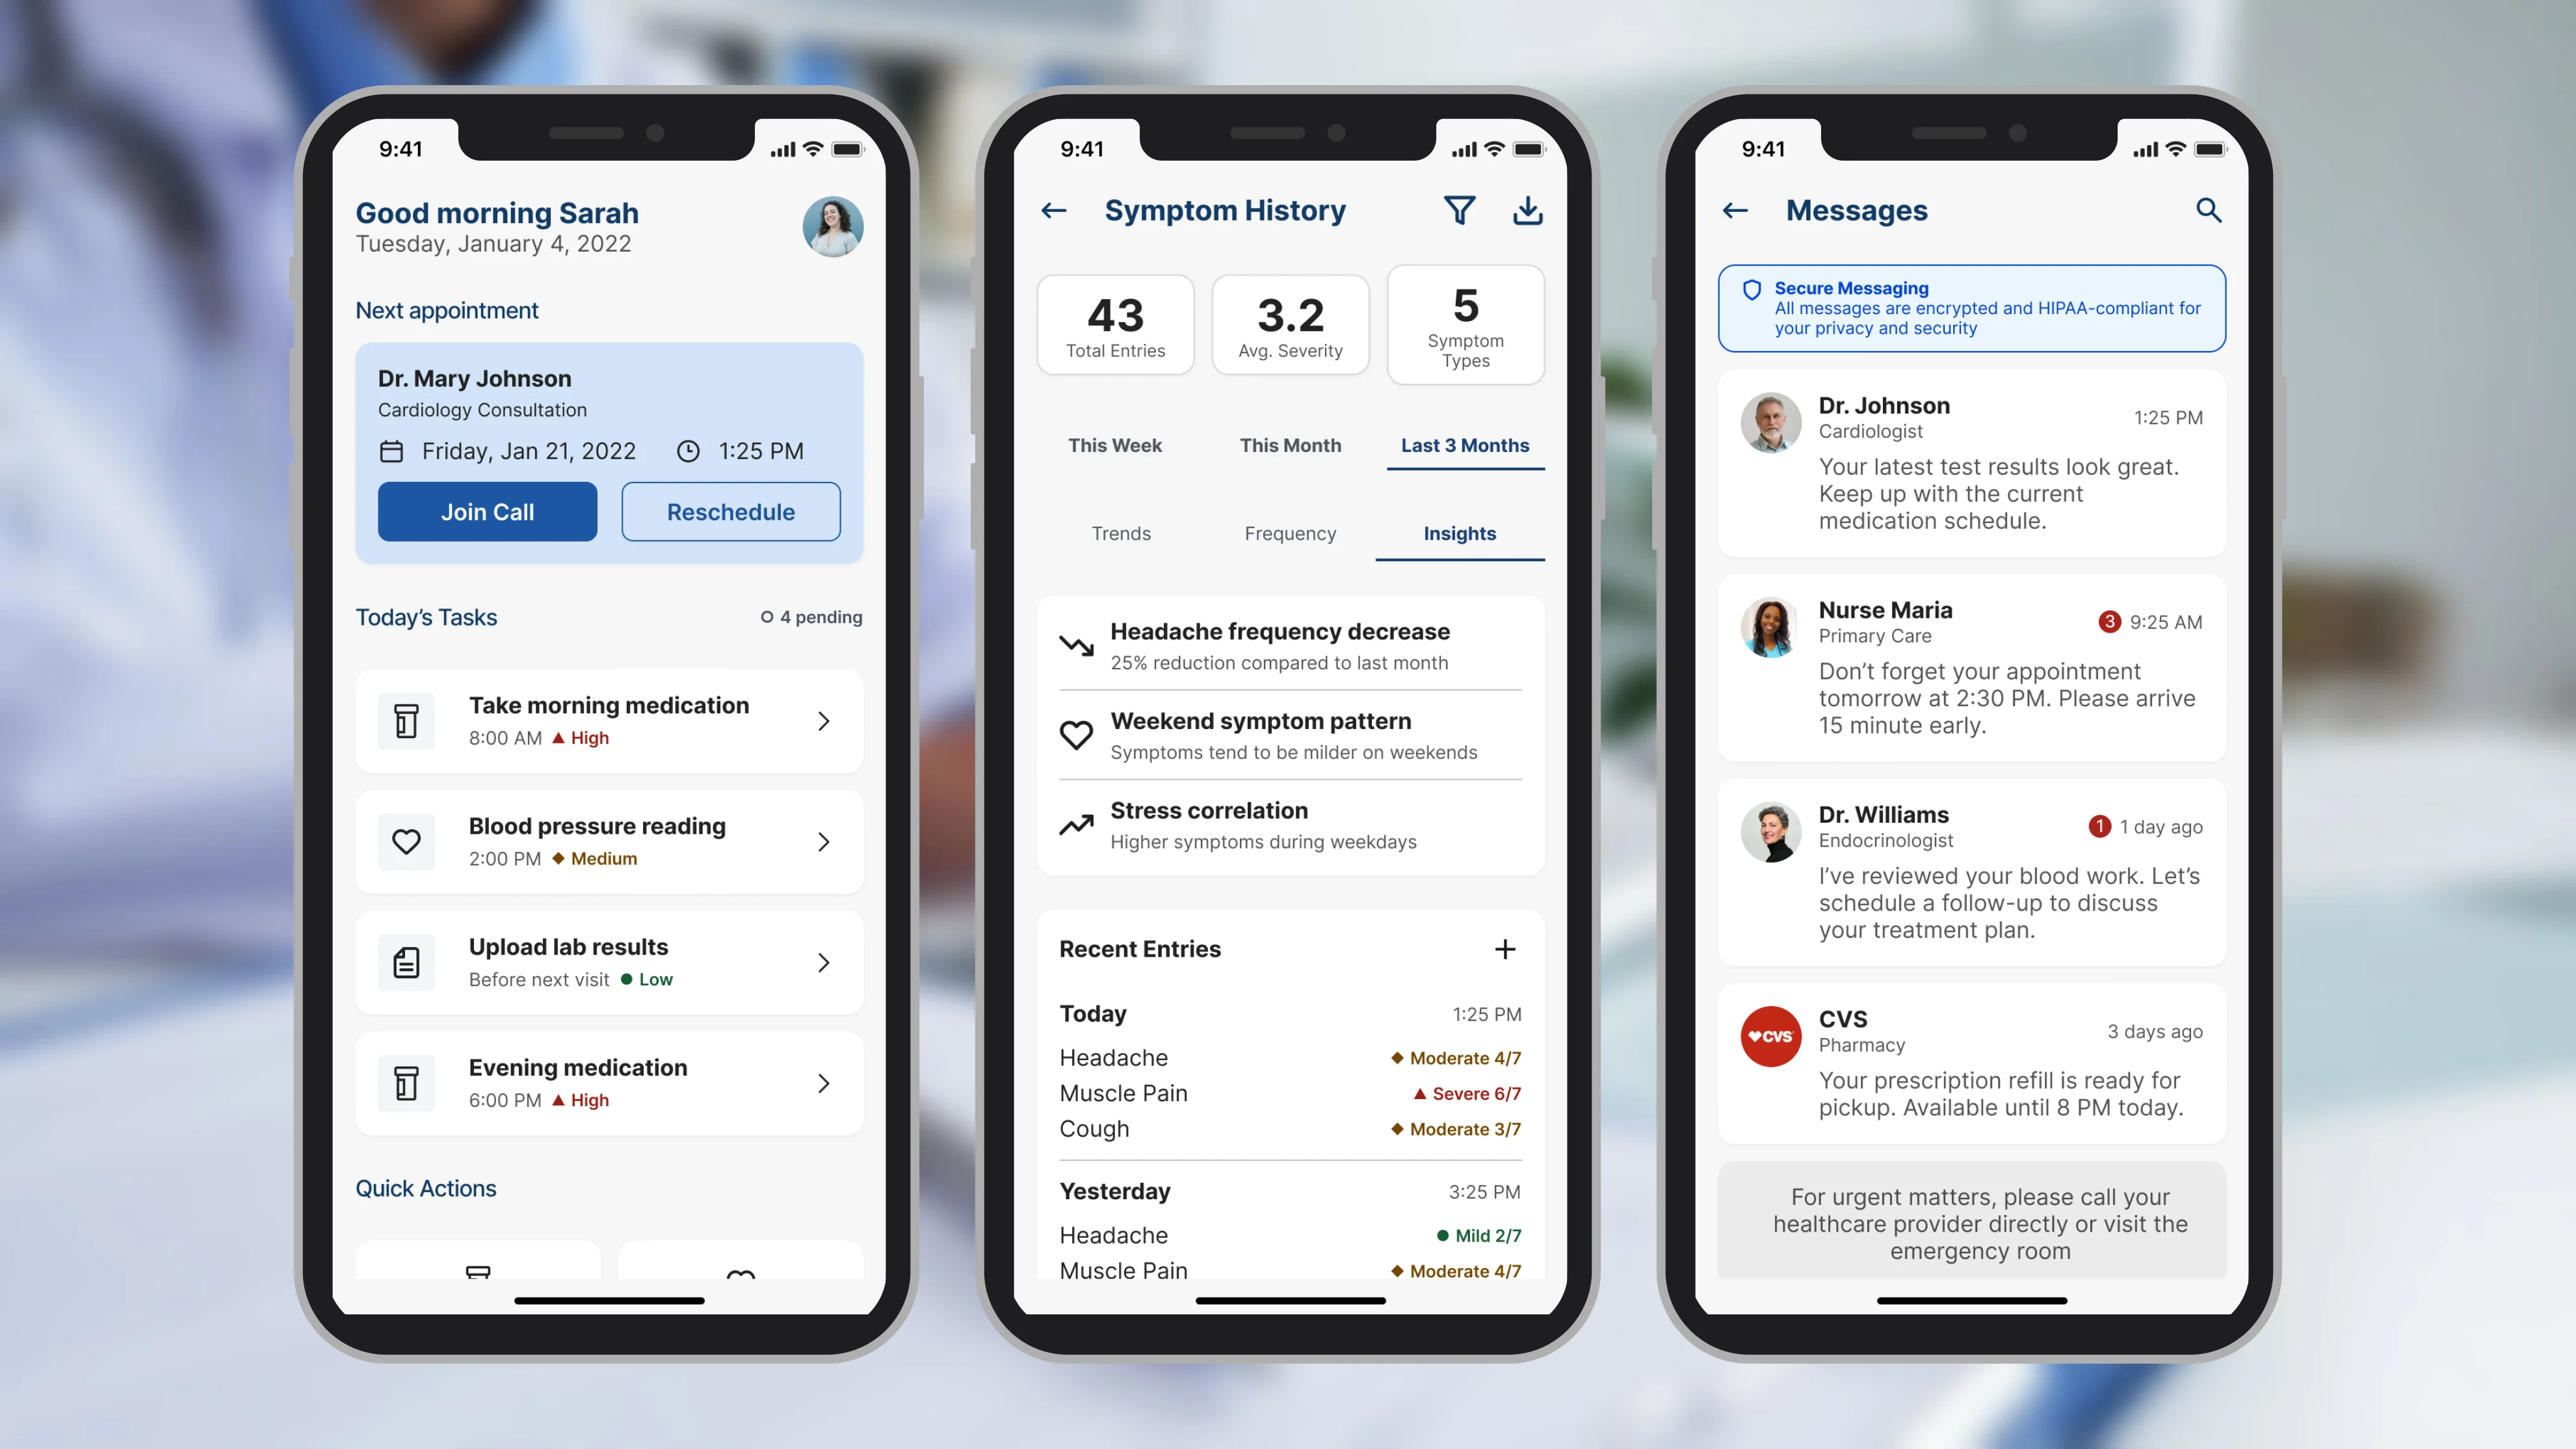
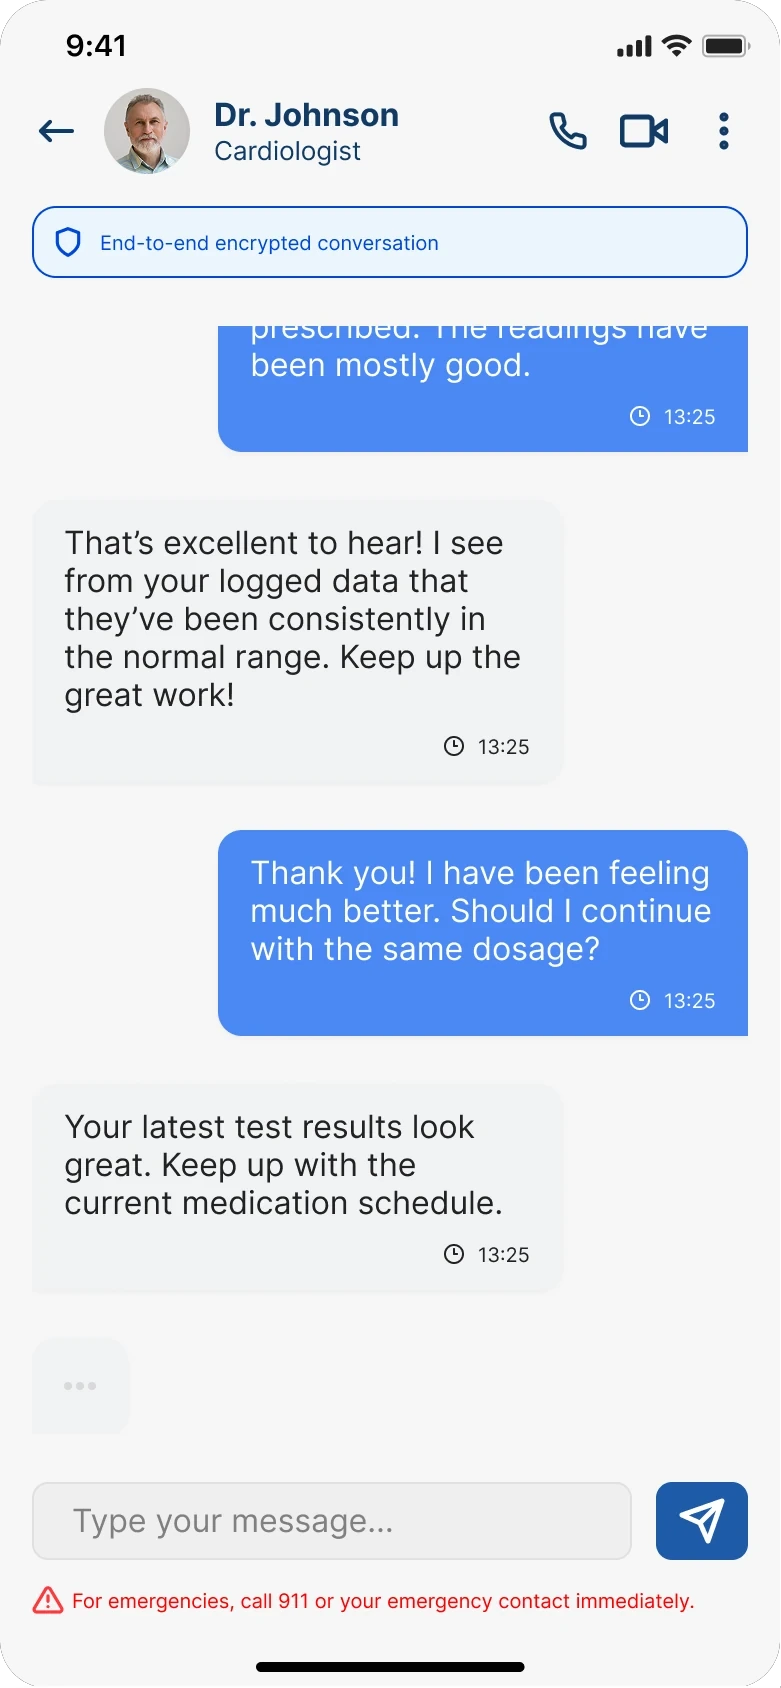
SoteriaMe keeps a patient connected to their care plan between visits
It is a mobile app for patients managing chronic conditions. What they log reaches the clinician in the thread the clinician already uses.
Nobody could talk to the patients, so clinicians became the research lens
GDPR and clinical governance limited direct patient access from the start, so the research was triangulated.
- 8
- Interviews with consented patients, through Infocare’s clinical partners
- 4
- Clinician workshops across three clinical sites
- 27
- Notes in the affinity map, alongside desk research and competitive analysis
Clinicians carry daily working knowledge of what patients forget to say in appointments, where they disengage, and what they misunderstand. The affinity map’s two heaviest clusters are the two the product was organised around.
- Trust and compliance8 notes
- Patient needs7 notes
- Clinician needs6 notes
- Healthcare context6 notes
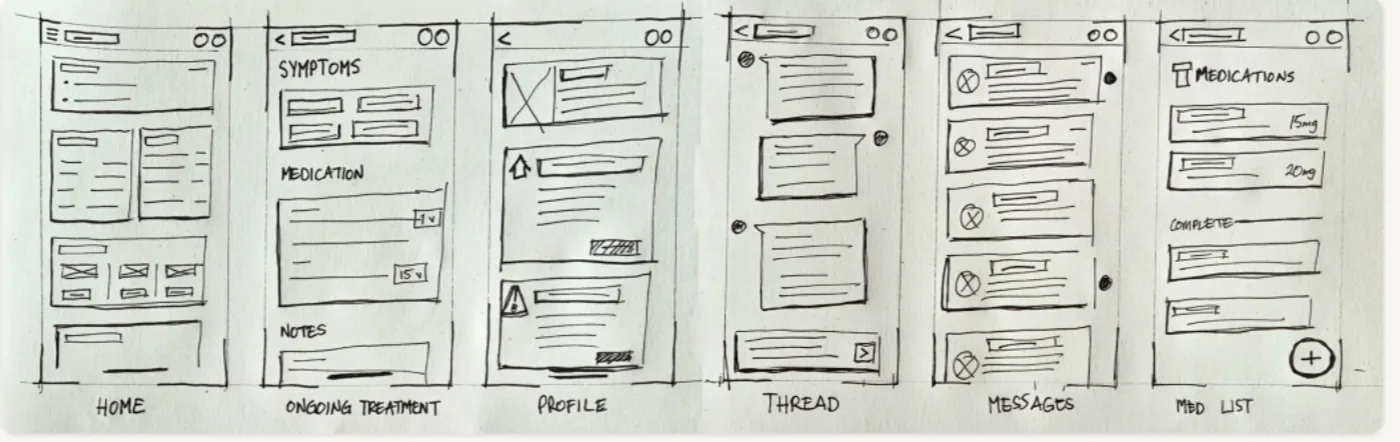
The patient needed less. The clinician needed more.
Along the patient journey, anxiety doesn’t go away. It changes form.
- The patient
- Less information, fewer choices, plainer language
- The clinician
- More signal, more visibility, more automation
- DiscoveryOverwhelmed, anxiousNeeds trust before commitment: reassurance that this is official and safe, before the download.
- RegistrationHopeful but unsureNeeds a plain-language explanation of what data is shared, when, and with whom, before it is asked for.
- First useOverloadedNeeds one obvious primary action: an answer to “what do I do now?”
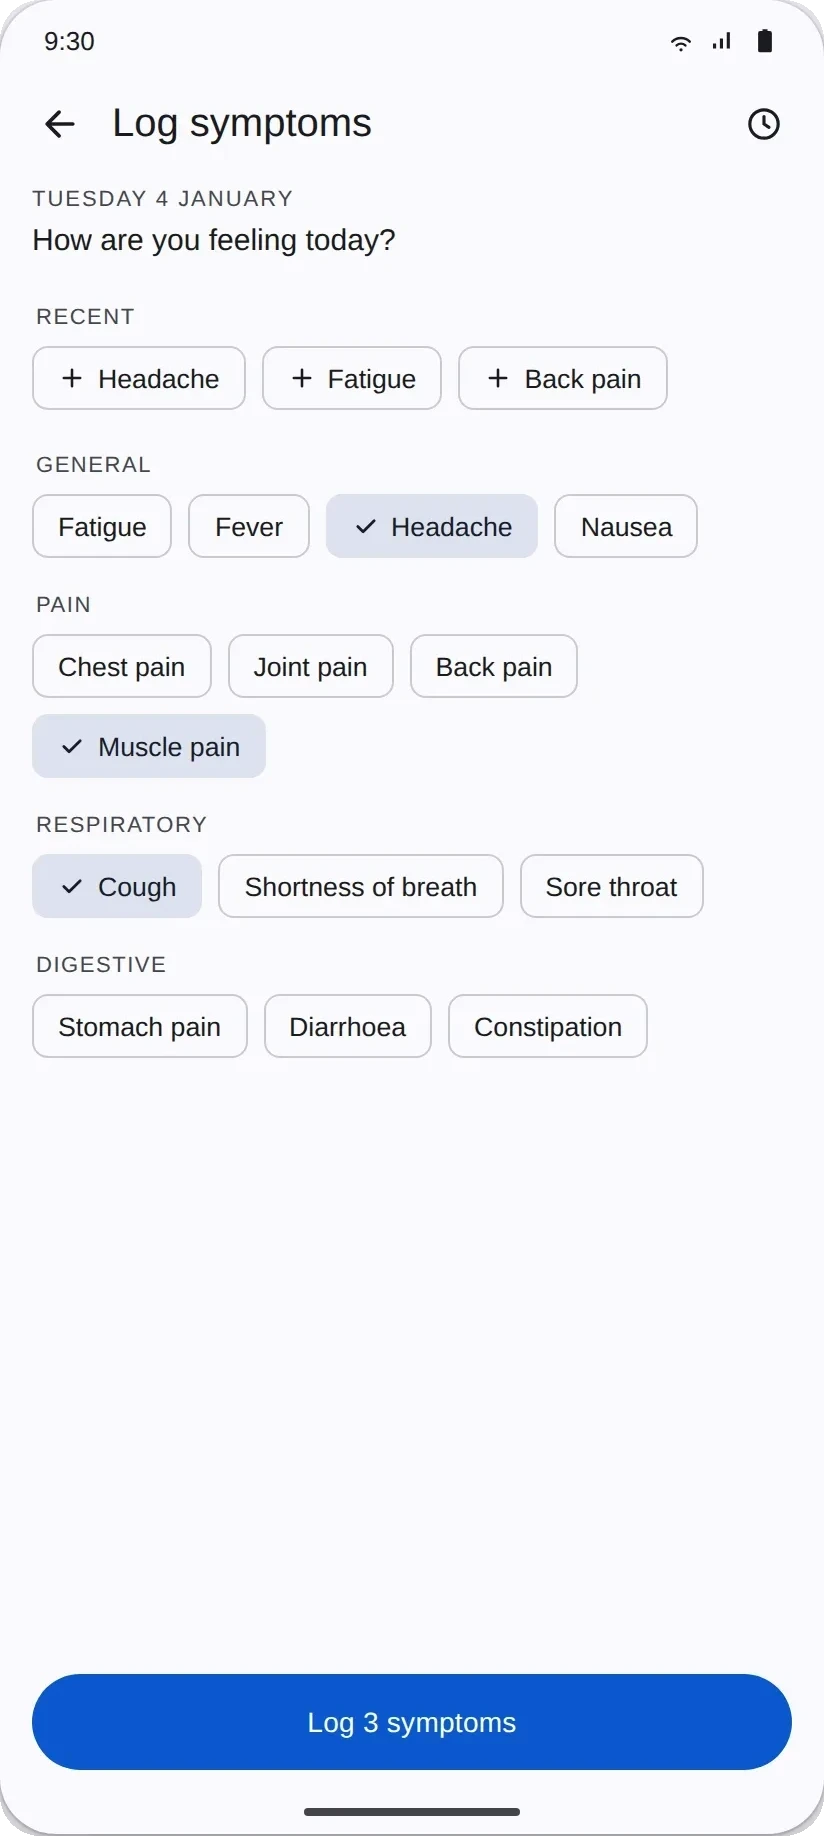
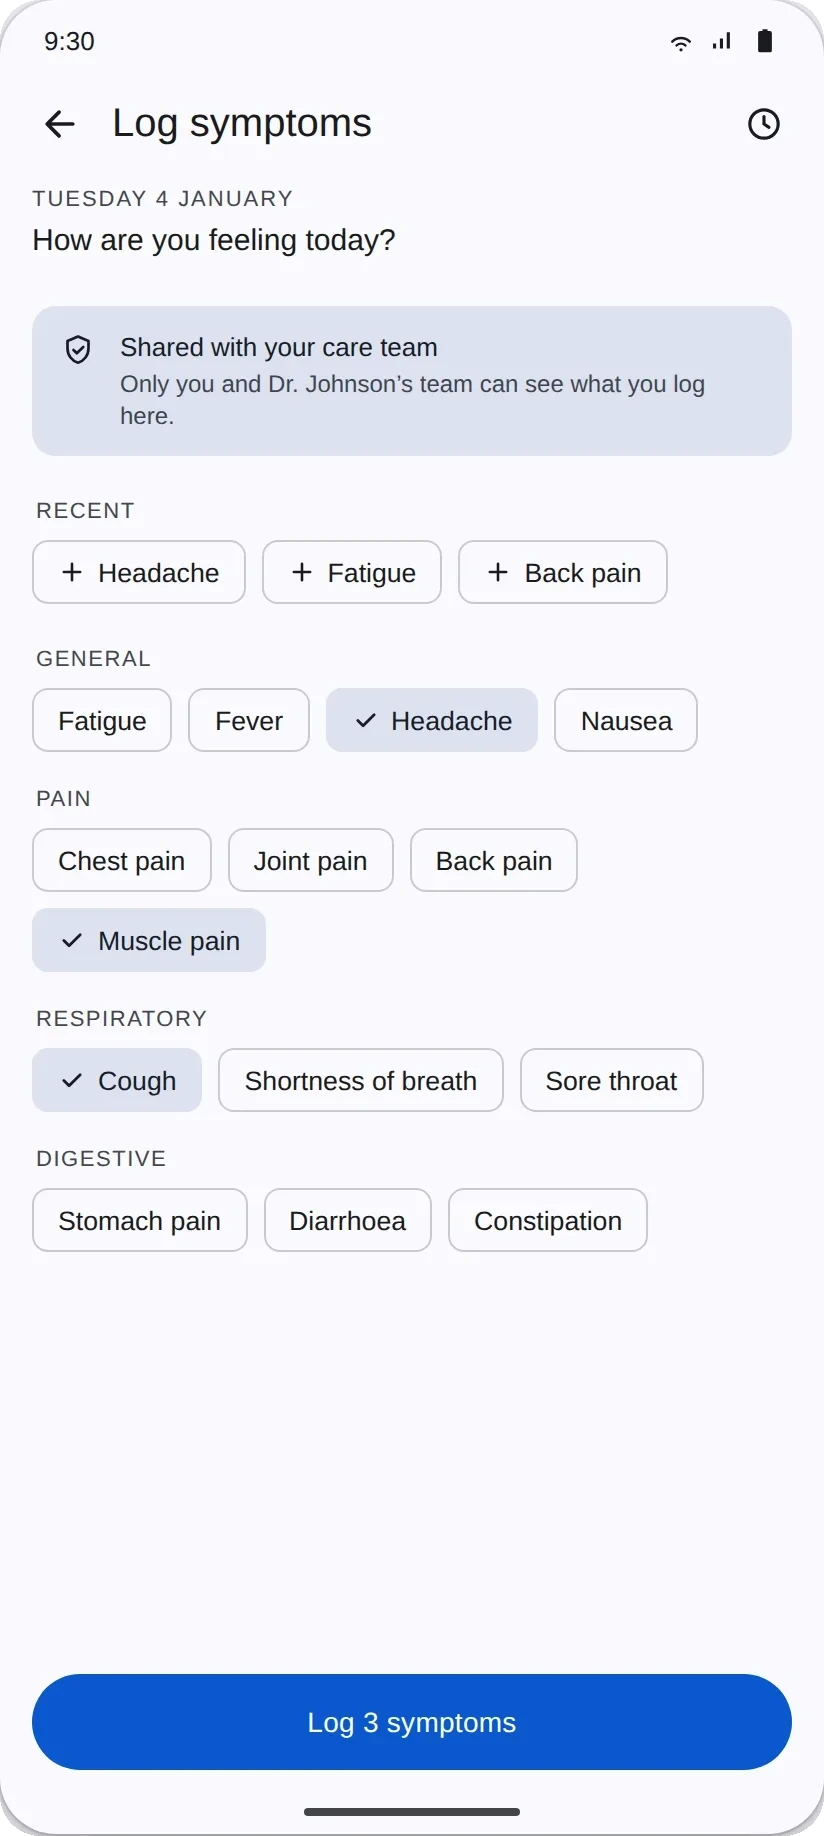
- Ongoing useAnxious, uncertainNeeds visible context at the point of entry: “shared with your care team” or “only you can see this.”
Each stage’s design need became a principle.
- Earn trust before asking for data.
- One thing at a time.
- Make data visibility persistent and contextual.
One hub, no navigation
- Rejected
Six core views behind six navigation items- Chose
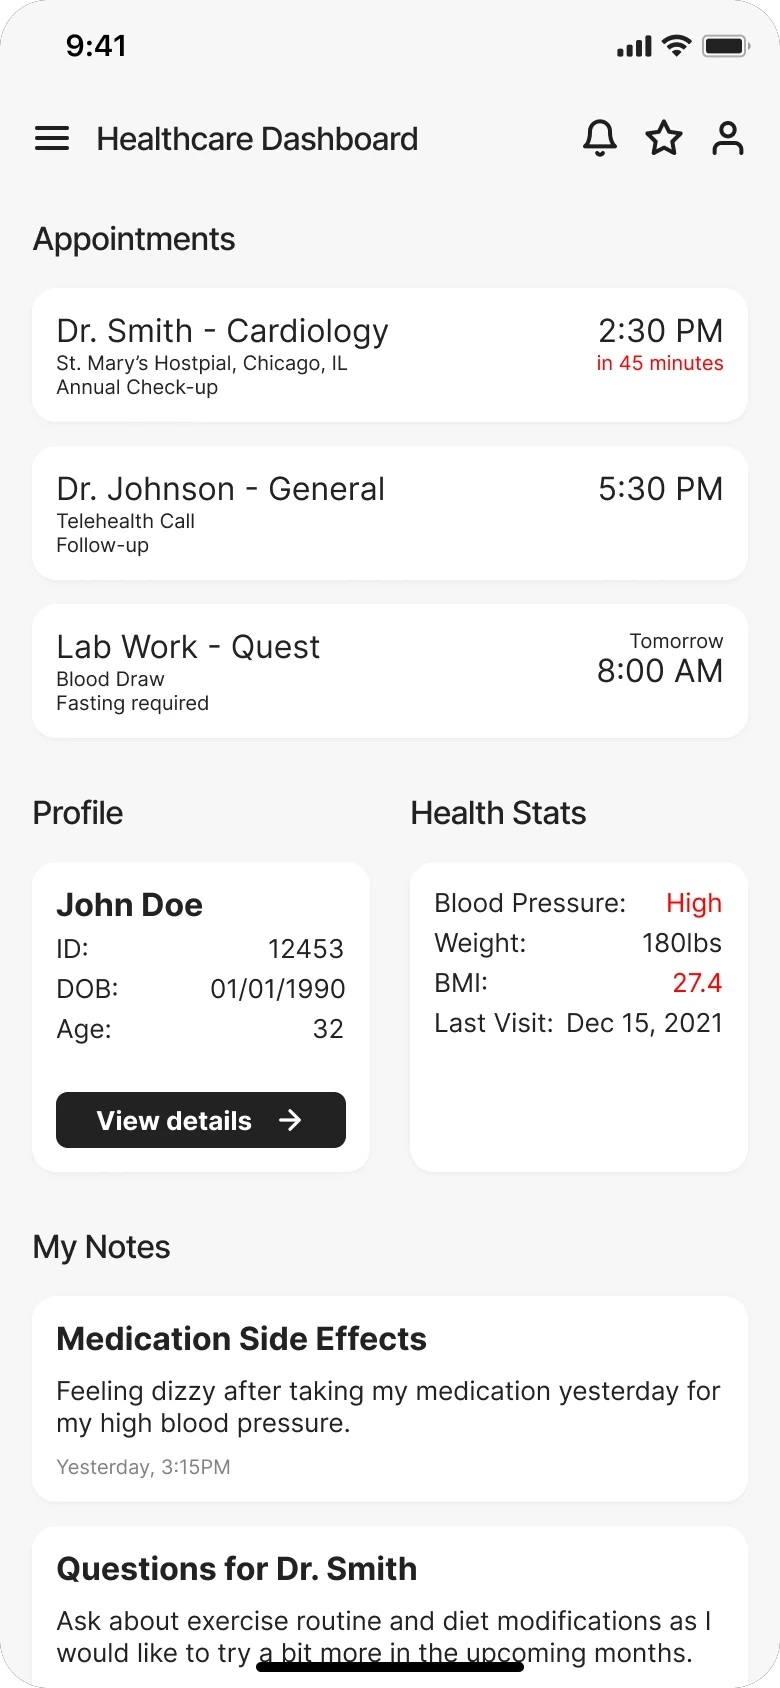
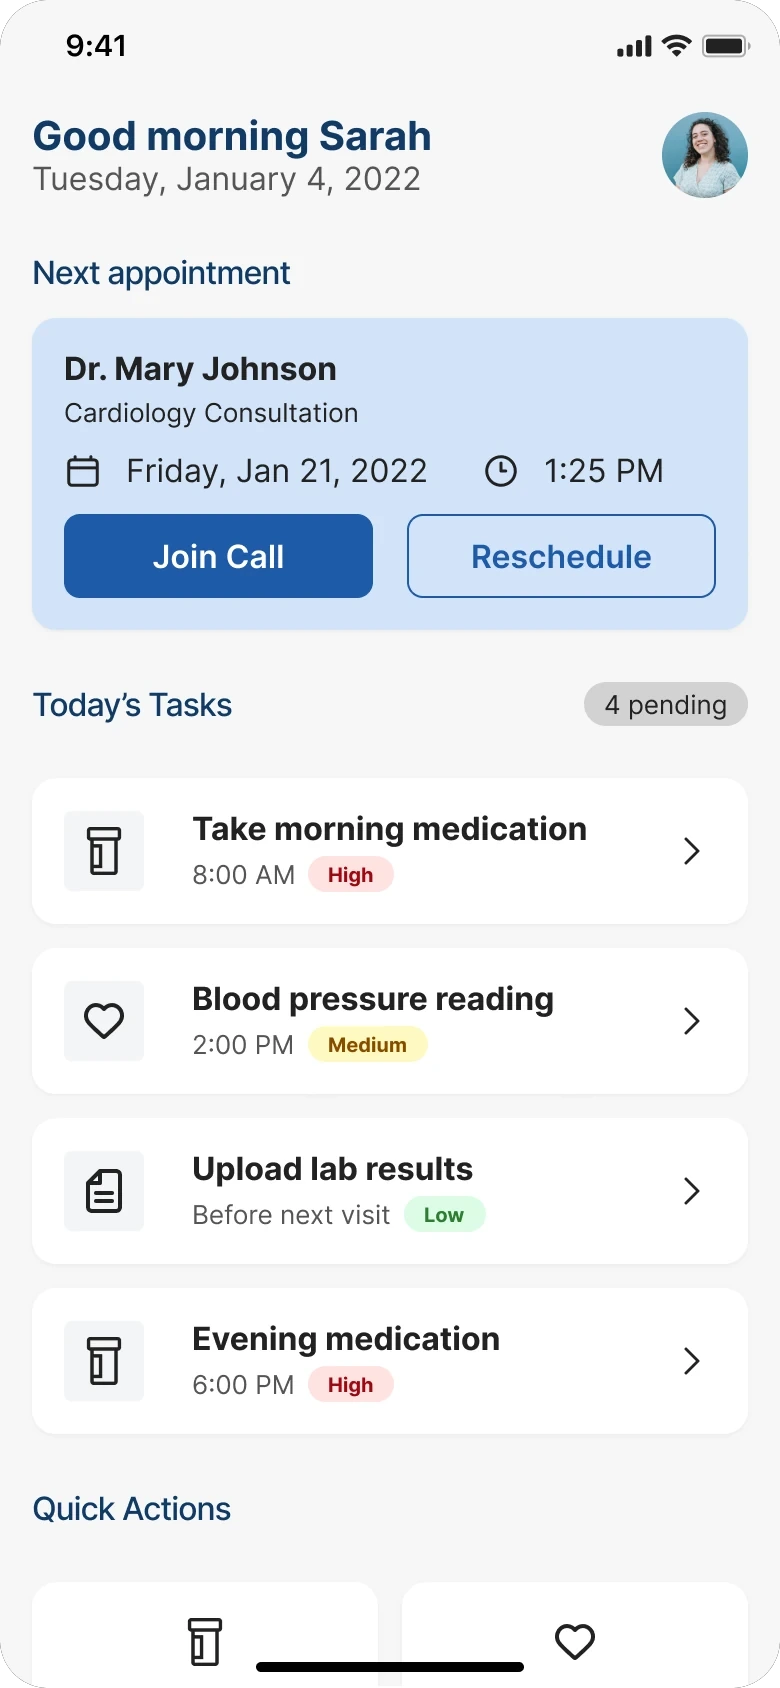
- A single dashboard, with the next appointment as the primary action
Clinical advisors confirmed what the research implied: patients often arrive with cognitive load already high, and a dashboard that required scanning before acting was going to be abandoned.
Trust turned out to be typography
- Rejected
A consent screen at onboarding- Chose
- A plain-language visibility label at every point a patient enters data
A consent screen treats trust as a legal requirement and puts all the weight on a moment when patients are already overwhelmed. Those small typographic decisions turned out to matter more than any structural change.

Severity that works without colour
- Rejected
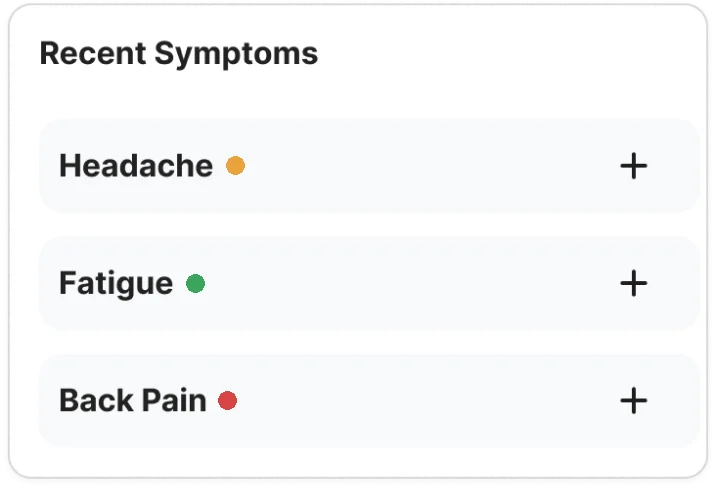
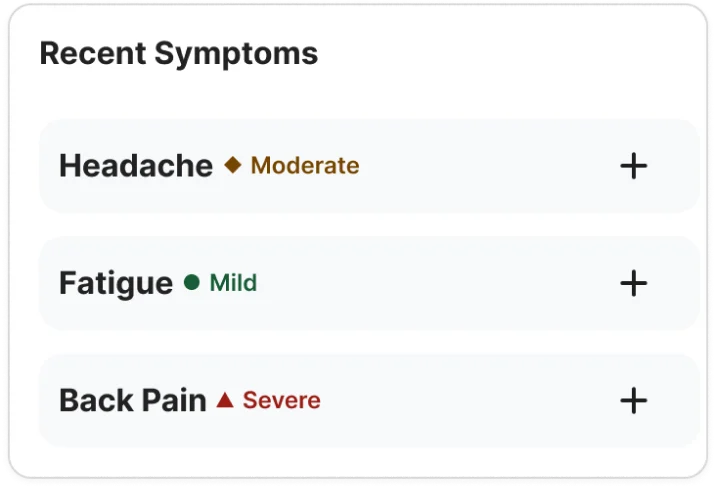
A colour-only scale: red, amber, green- Chose
- Colour, icon and label together
The patients were often older, often carrying multiple diagnoses, so WCAG AA was treated as a floor. The colour-only version was abandoned because it would have failed patients with colour vision deficiencies silently, and the failure would never have surfaced in testing.
Round one showed where it failed. Round two, every patient got through.
Four clinical advisors went through the full prototype. Two issues were marked blockers and rebuilt before patient testing began.
Then came two rounds with patients: five participants aged 34 to 67, three tasks with no prompting. I rebuilt the two flows round one broke on and ran the same tasks again. In the chart, each dot is one patient.
- Set up a reminder unprompted.
- Round one:
- Round two:
- Stopped to ask who sees their data.
- Round one:
- Round two:
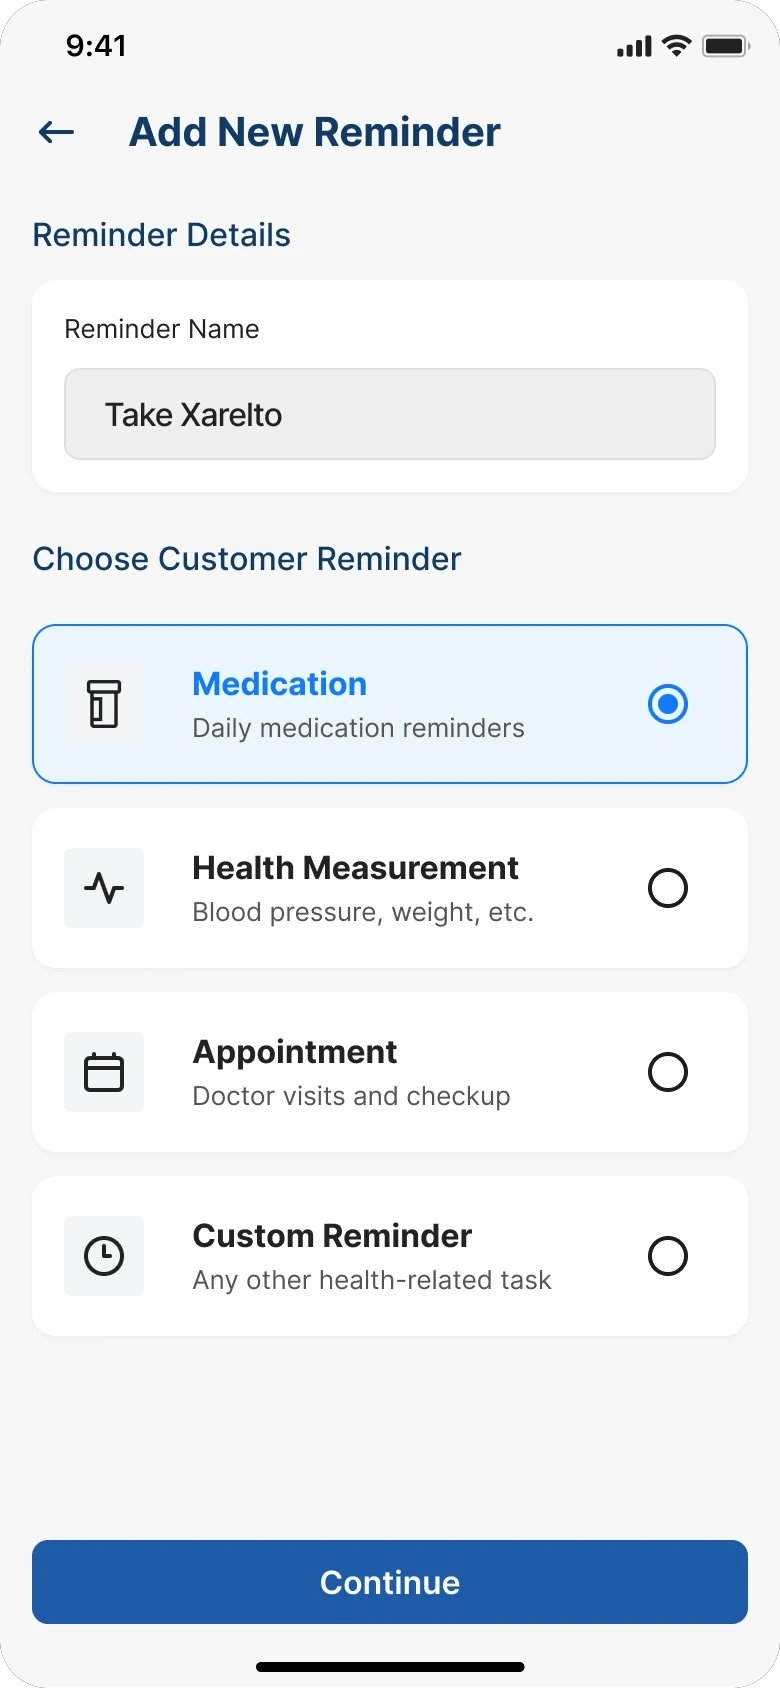
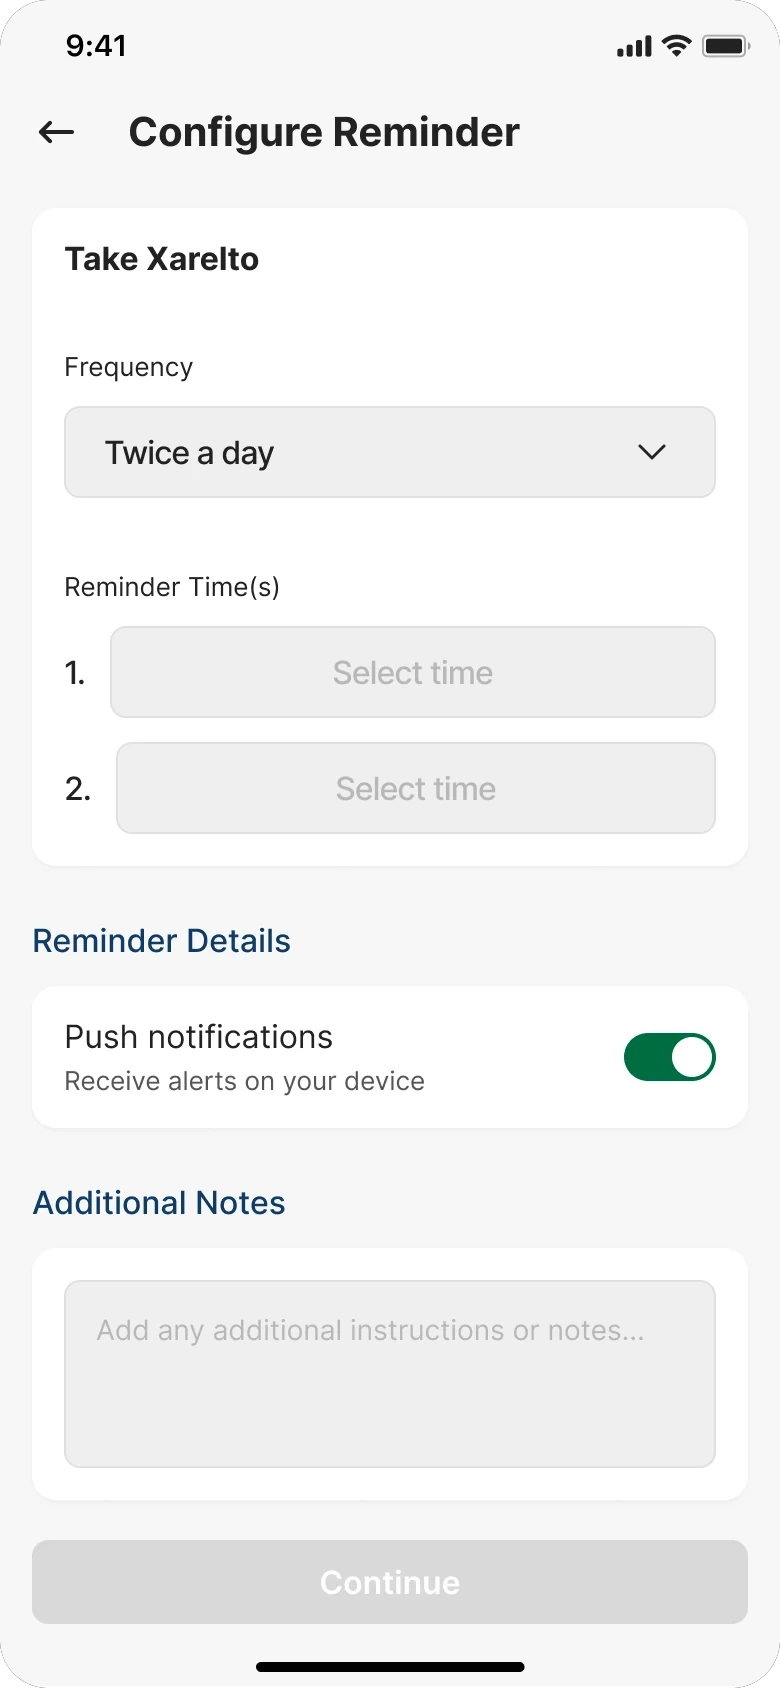
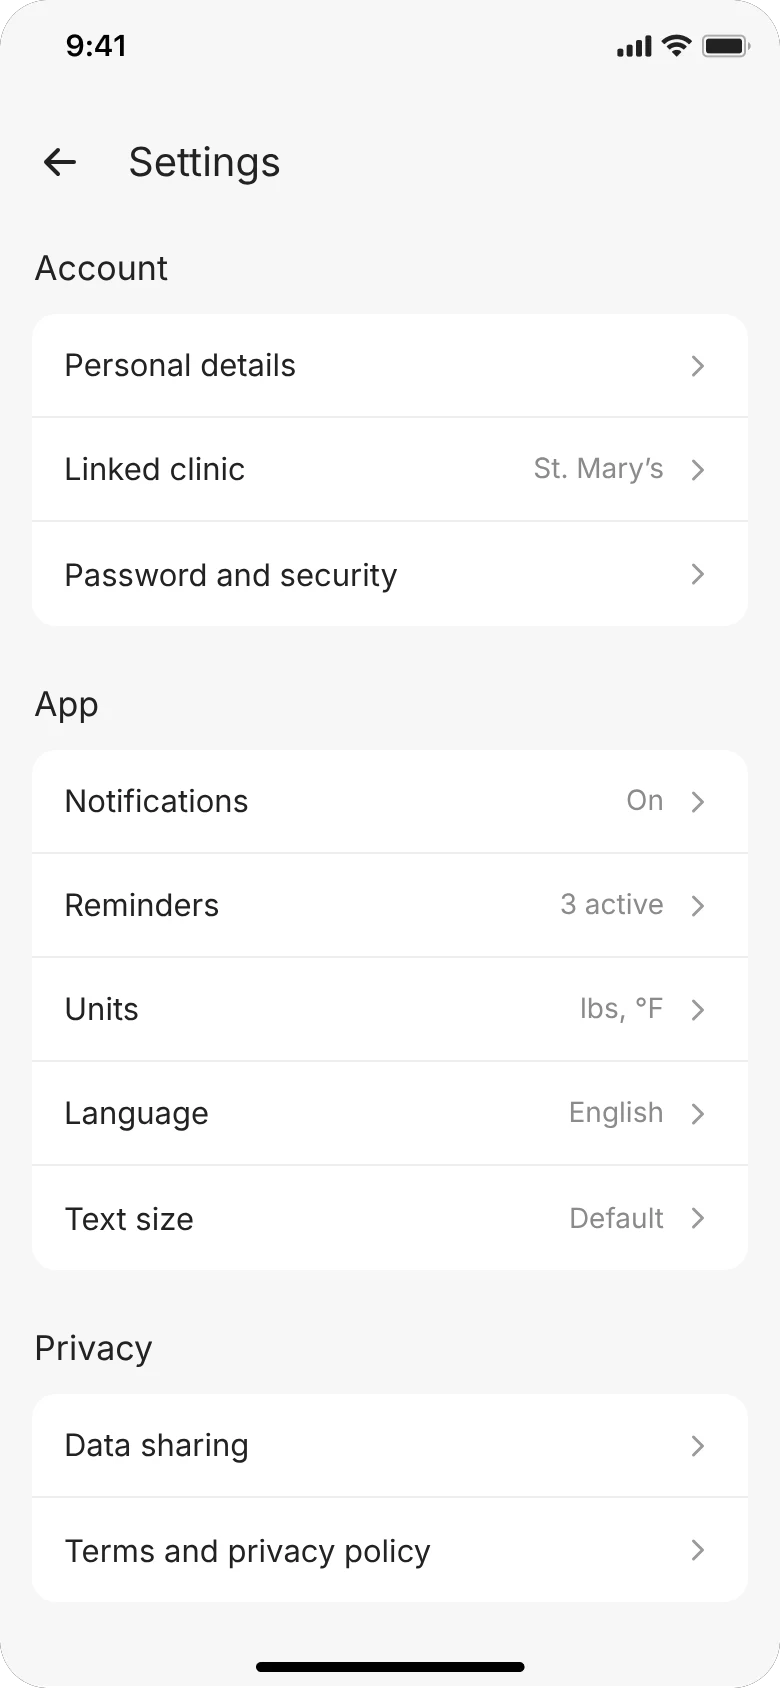
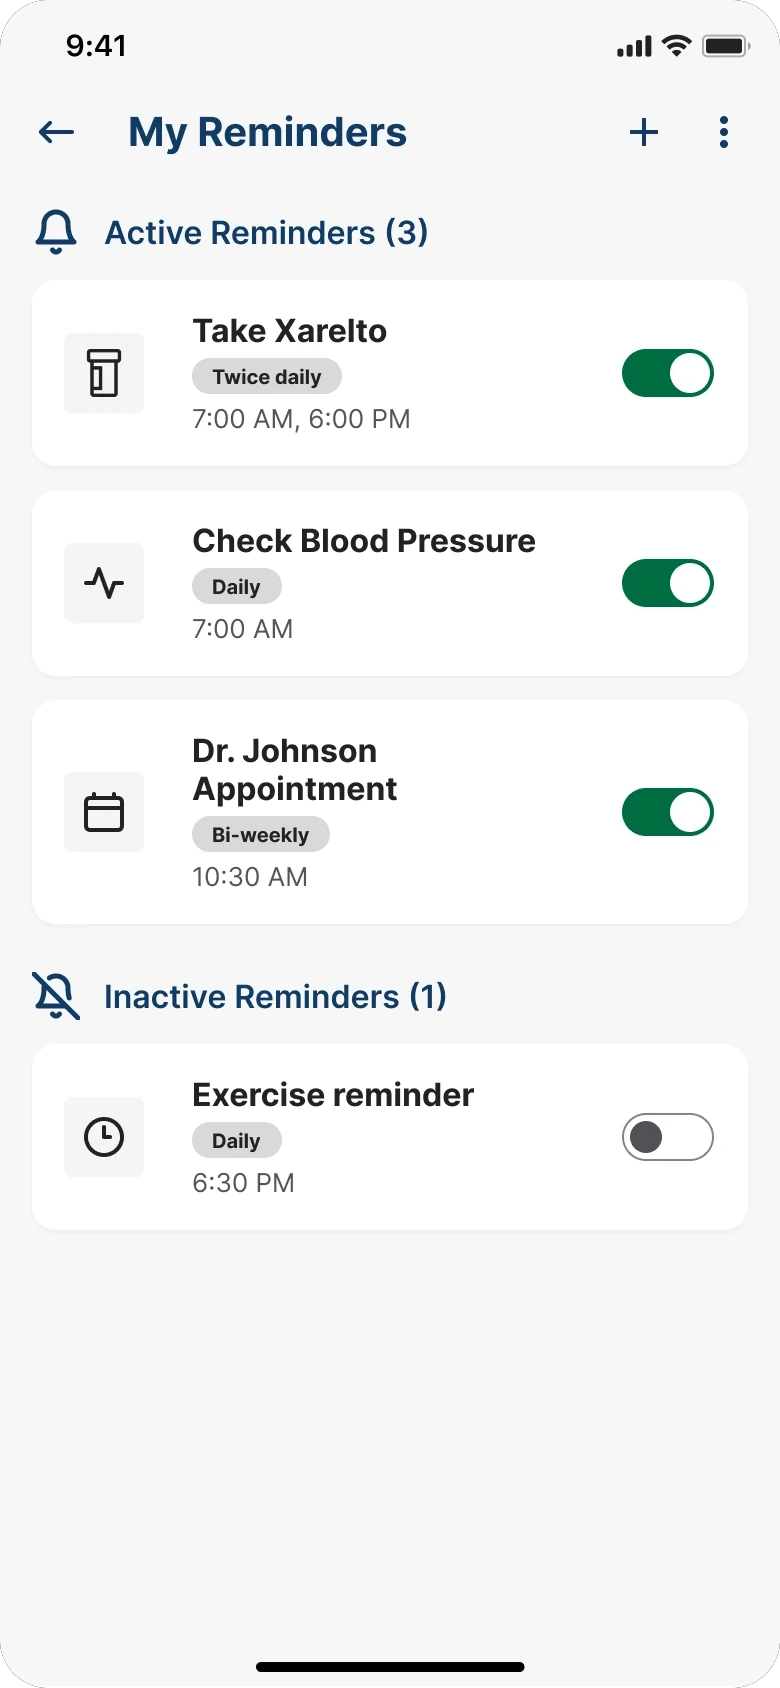
Reminders had been a row inside a settings list. Two of five participants never found the old route. All five walked the new one without being asked twice.
The same five people took part both times, so familiarity is doing some of the work in round two.
What shipped, and what nobody measured
SoteriaMe was piloted through Infocare’s clinical partners across a small number of US clinics. The pilot ran without the instrumentation to measure engagement at scale, so the strongest evidence is qualitative.
“It’s easier to remember what the doctor said when it’s all written down here.”
Patient, usability testing
The product served a second purpose Infocare cared about equally: demonstrating that they could build a credible patient-facing digital product. The app was used directly in conversations with prospective healthcare clients.
What I’d do differently
Running this again, I’d set up a proper measurement framework: a baseline appointment-miss rate before launch, medication log completion tracked in-app, and a cohort comparison between engaged and disengaged users against downstream clinical outcomes. None of that was feasible within the project’s scope.